Analytics
The analytics page shows your AI agent’s calling performance. You’ll find it under the Analytics tab in the top navigation bar. Use it to track call volume, contact rates, and conversions.
Filters
Section titled “Filters”Two filters at the top of the page control which data you see:
- Date range (top right): Choose from presets like This Week, This Month, Last 7 Days, Last 30 Days, All Time, or set a custom range.
- Agent (top left): View metrics for all agents combined or select a specific agent.
Both filters apply to every metric and chart on the page. Narrowing the date range or selecting a single agent updates all cards and the engagement funnel at once.
Excluding test numbers
Section titled “Excluding test numbers”If you or your team make test calls, those can inflate your metrics. You can exclude test numbers so they don’t count toward any metrics on the page.
- Click the Exclude Test Numbers gear icon in the top-right area of the page.
- Click + Add Number and enter the phone number you want to exclude.
- Optionally add a note so you remember whose number it is.
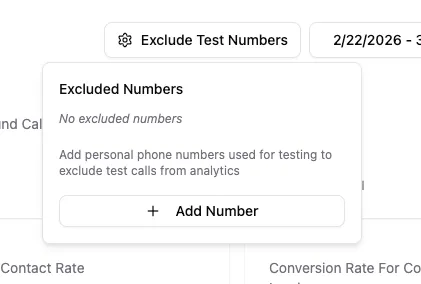
Excluded numbers take effect immediately across all metrics.
Metrics
Section titled “Metrics”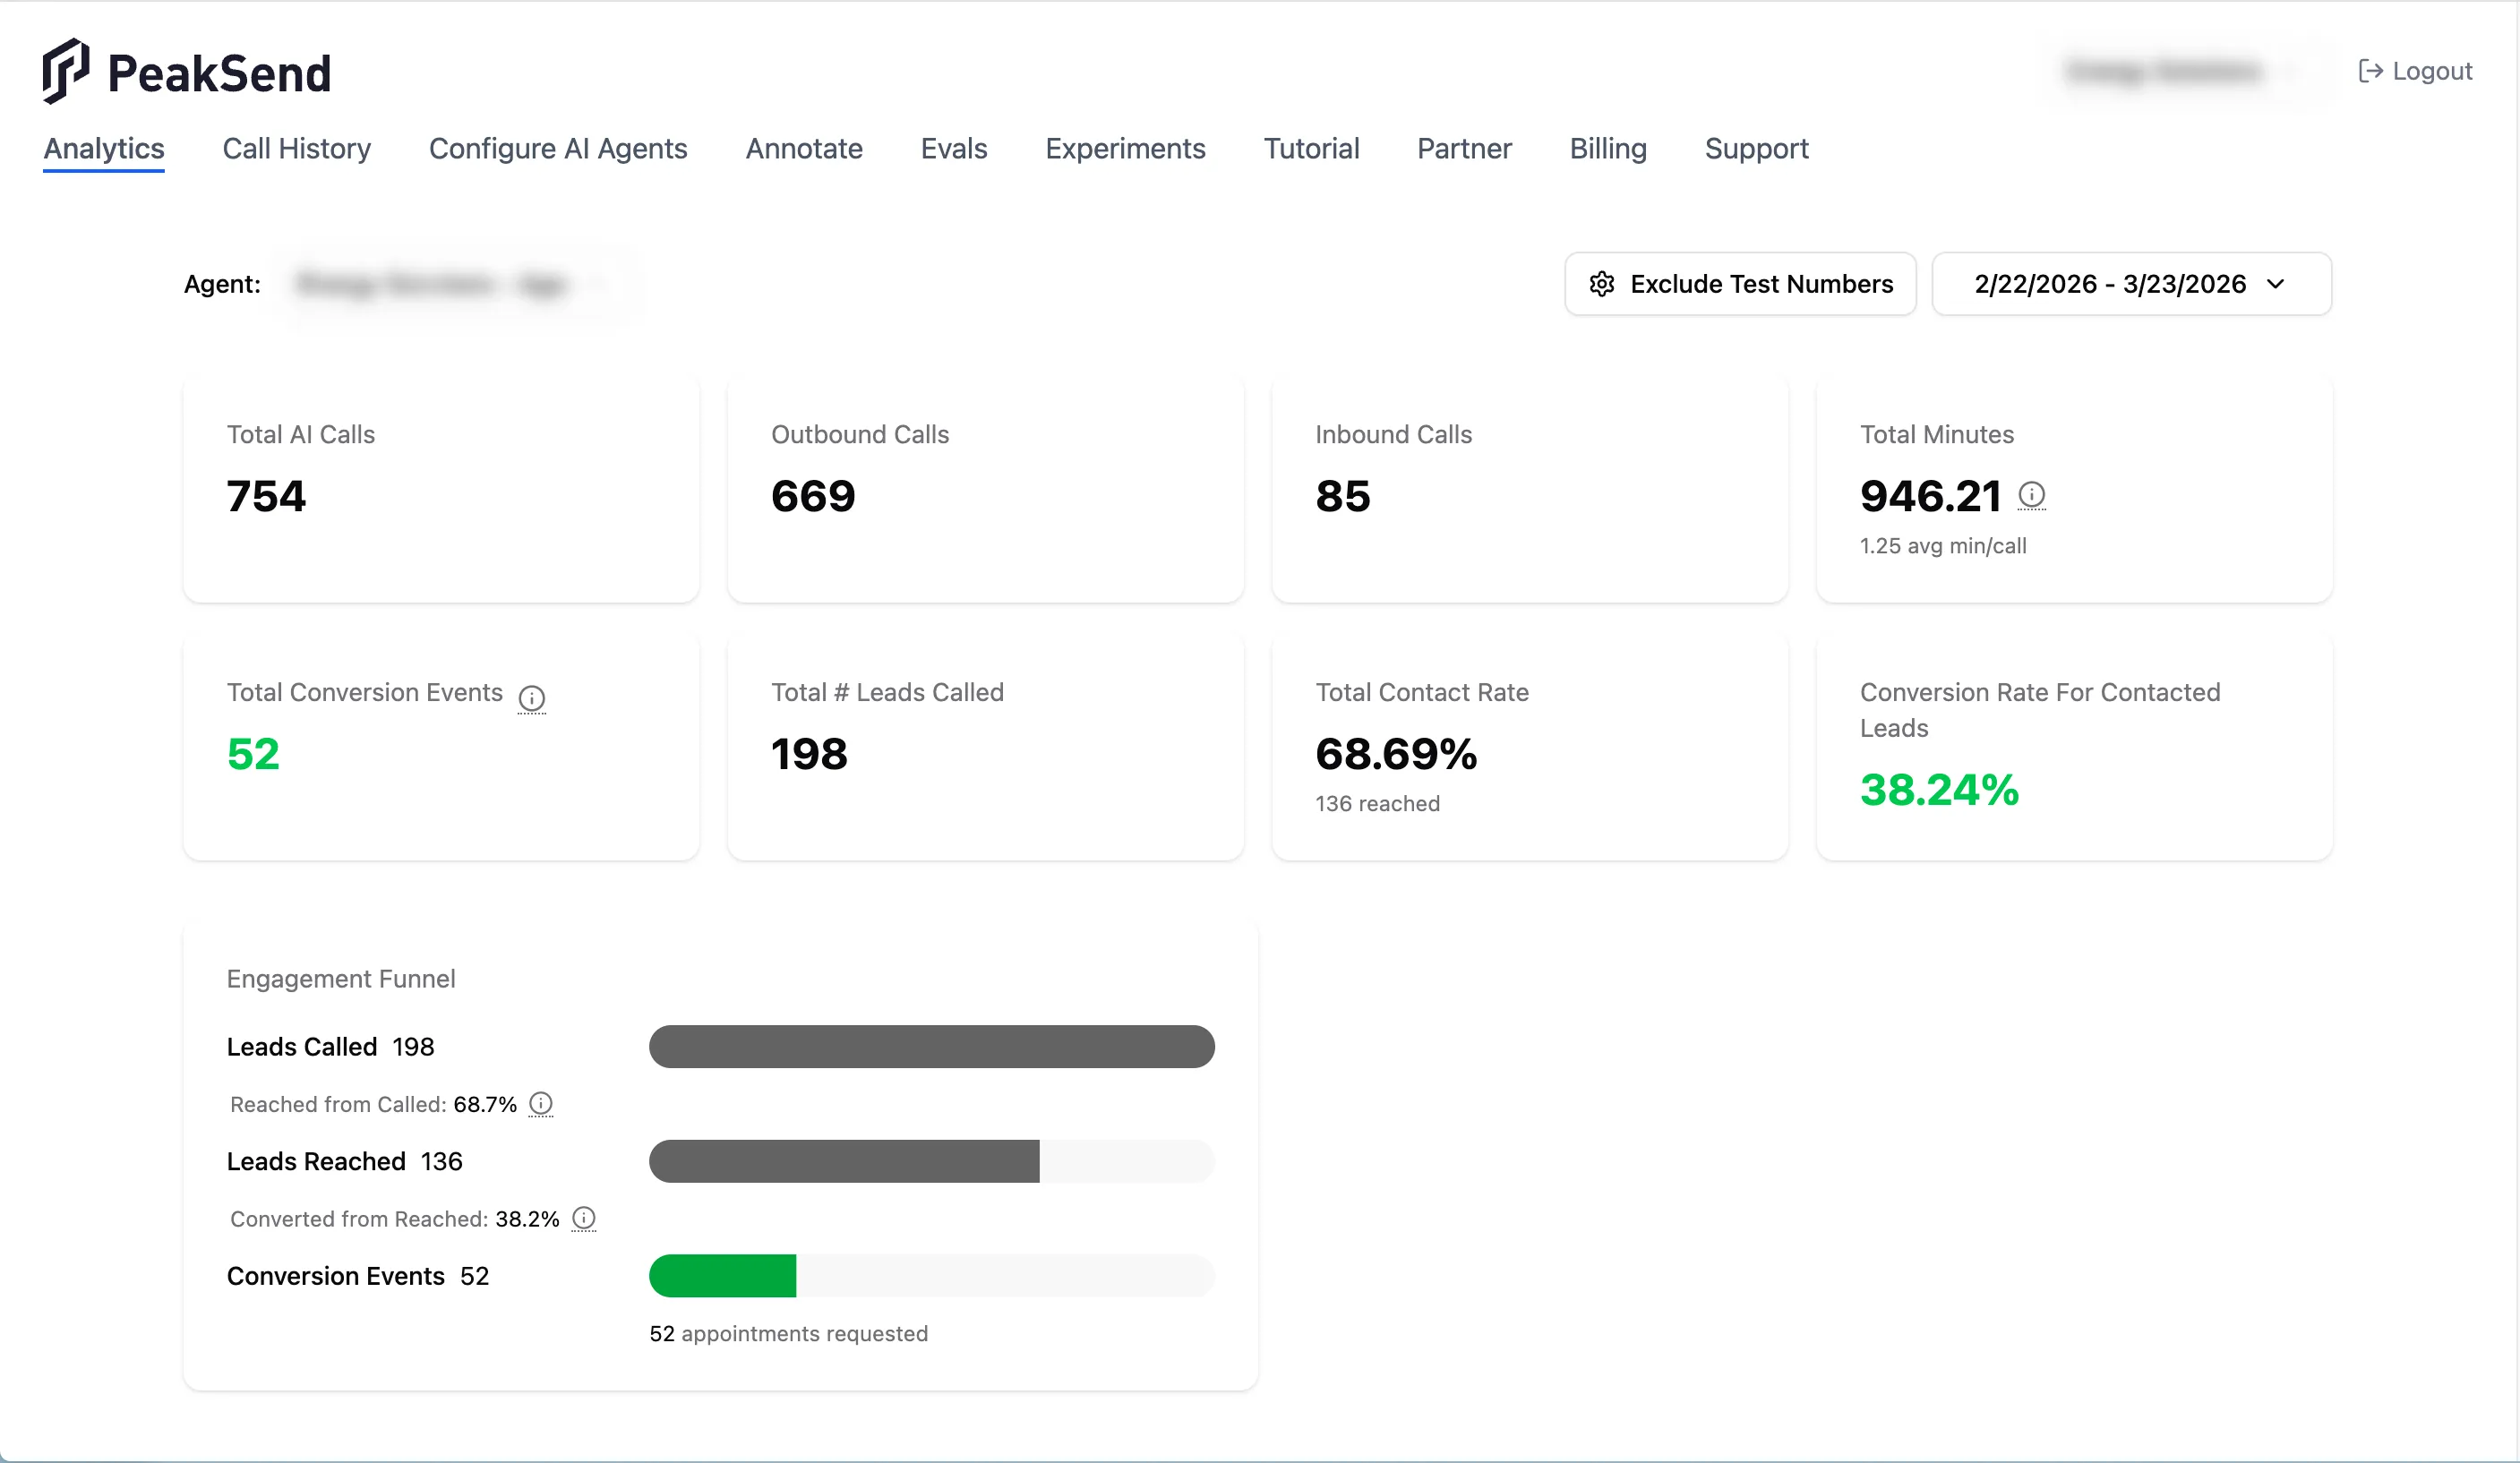
Eight metric cards appear at the top of the page:
- Total AI calls: The combined count of all inbound and outbound calls in the selected period.
- Outbound calls: Calls your agent made to leads.
- Inbound calls: Calls received by your agent.
- Total minutes: Combined talk time across all calls. Each call is rounded up to a 1-minute minimum to match billing; after the first minute, time is billed by the second. The smaller text below shows the average minutes per call.
- Total conversion events: The number of successful conversions. What counts as a conversion depends on your agent’s goal: either completed transfers or booked appointments.
- Total # leads called: The number of unique leads your agent dialed.
- Total contact rate: The percentage of leads that answered at least one call. This number increases as PeakSend dials your leads multiple times through follow-up cadences. The smaller text below shows the count of leads reached.
- Conversion rate for contacted leads: Conversions divided by leads reached.
Engagement funnel
Section titled “Engagement funnel”Below the metric cards, the engagement funnel breaks down your calls into three stages:
- Leads Called: Total unique leads dialed.
- Leads Reached: Leads that answered. The percentage between this stage and the previous shows your contact rate (reached from called).
- Conversion Events: Leads that converted. The percentage between this stage and the previous shows your conversion rate (converted from reached).
Below the funnel, a breakdown shows what type of conversions occurred: successful transfers, appointments requested, or backup appointments.
Using analytics to diagnose issues
Section titled “Using analytics to diagnose issues”Low contact rate: Your leads may not be picking up. Common causes include low-quality lead lists or not enough follow-up attempts. Try adding more steps to your follow-up cadence to give leads more chances to answer.
Low conversion rate: Leads are answering but not converting. This usually points to a script that needs adjustment. Review recent calls, and determine why leads are falling off. Are people not interested in the hook? Are there common objections that aren’t handled in the Objections section of your script? Is the AI saying things that you wouldn’t say? Make updates to your script to try to resolve these issues. Getting your script to convert well takes time, but it pays off in the long run.